Health Monitor Events
This section outlines a critical enhancement to Verifone’s remote diagnostics solutions. This section provides the necessary background, identifies the problem statement, and offers an overview of the proposed solution. Subsequent sections delve into the operational aspects, including the target software stack required to implement the enhancements, a configuration guide for deployment, and other integration details.
Background
Remote diagnostics play a crucial role in reducing the total cost of ownership for card payment acceptance devices. Verifone currently offers robust remote diagnostics capabilities through its Terminal Management System (TMS) known as Verifone HQ (VHQ). The existing capabilities include:
- Software Log Export: Ability to export detailed software logs for analysis.
- Remote Reboot: Capability to remotely reboot the device.
- Diagnostic Alerts: The device can alert the VHQ server with standard and custom diagnostics, such as low memory warnings, faulty battery notifications, and the number of reboots.
The alert mechanism primarily focuses on the remote diagnosis of hardware issues, facilitating proactive maintenance. However, recent production incidents caused by incorrect software and configuration updates have adversely impacted the devices’ ability to process payments. These incidents underscore the need for enhanced remote diagnostics of the application software on the device.
Problem Statement
Despite comprehensive efforts in functional and operational testing of payment applications, discrepancies between test and production environments, along with user errors in terminal management systems, can adversely impact the operational integrity of payment devices. In the worst-case scenario, erroneous software or configuration updates could render devices incapable of processing transactions, resulting in significant revenue loss for merchants.
Currently, operational and functional anomalies are reported by end users, such as store managers, which triggers reactive troubleshooting and root cause analysis by Verifone’s technical support and engineering teams. This reactive methodology is suboptimal and highlights the necessity for Verifone to implement proactive health monitoring and anomaly detection for payment devices.
There is a strategic opportunity to augment Verifone’s remote diagnostic capabilities to encompass comprehensive health monitoring of application software deployed on payment devices. It is imperative to establish systematic checks and balances to proactively identify and mitigate issues arising from unintentional operational or human errors during remote operations. This monitoring should be integrated with advanced remote diagnostics and automated recovery mechanisms wherever feasible.
Solution
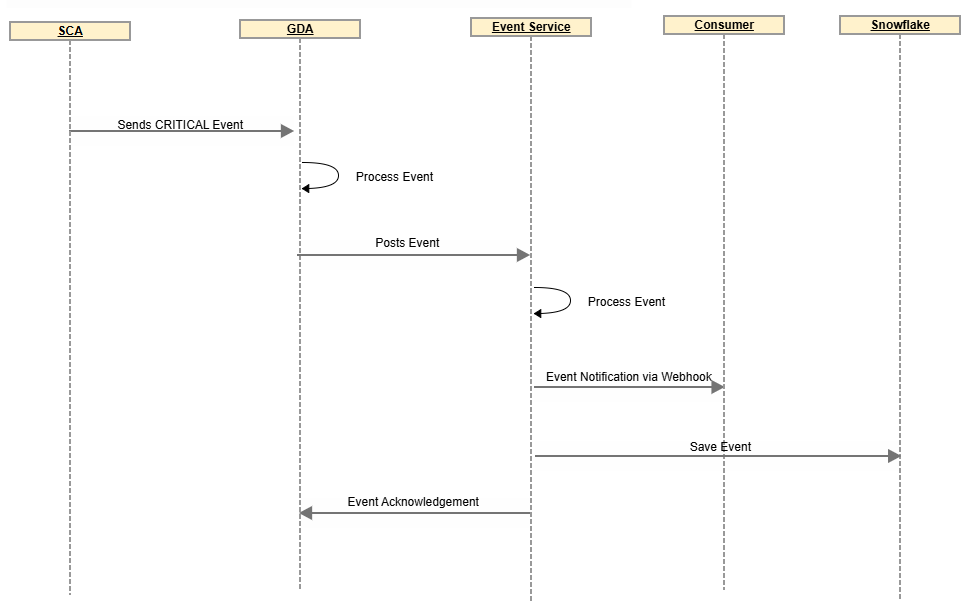
A dedicated diagnostics application, known as the Global Diagnostic Application (GDA), has been developed to collect health monitoring parameters via events from the payment application and transmit them to the Event Service on the Verifone server. GDA functions as a background service, capable of receiving event notifications from any application software on the device. It subsequently forwards these events to the Event Service. Additionally, the application autonomously monitors critical system-level parameters such as signal strength, network availability, and battery level.
The Event Service publishes these events to any subscriber via webhooks, with VHQ being one such subscriber. This architecture enables both VHQ and non-VHQ-based solutions to utilize this remote diagnostics feature.
Intended Audience
This guide is designed for users of the Health Monitor feature with the SCA Payment Application, including:
- Helpdesk Teams - Troubleshooting and diagnosing issues based on captured events.
- Integrators - Understanding event structures, integration with customer dashboards, and debugging.
- Customers - Gaining insights into trending issues in production and being proactive to arrest them. Customers can have access to these payment app health monitors via webhooks. This is available only for customers with VHQ premium licence.
Initialization of Functionality
This section outlines the essential prerequisites and steps required to begin using the Health Monitor feature in your lab environment to start with and then in production.
To get started, ensure that you have a terminal equipped with the required software stack that supports the Health Monitor capability. Once enabled, the terminal will automatically begin transmitting health monitor events to the Event Service on the Verifone server.
The GDA application is responsible for posting these events to the Event Service. Therefore, it is critical that your network allows outbound communication to the Event Service URL, which is specified in the Whitelisting section below. Please ensure that corresponding URL is accessible from your lab and prod environment to avoid communication issues.
To monitor these events on your end, you must register a Webhook with Verifone. This will allow the Health Monitor events to be pushed to your endpoint in near real-time, enabling proactive monitoring and diagnostics.
Finally, this section also covers the relevant configuration parameters on the GDA and SCA to successfully enable and manage the Health Monitor functionality.
Minimum Software Versions
For Terminals on ADK 4.7.x
| Component | Version Details |
|---|---|
| ADK | 4.7.42 |
| OTA (For M440/M424 Only) | 3.42.2 |
| SCA UGP Solution | 4.x.41-1 |
| Global Diagnostic App (GDA) | 2.0.0 |
For Terminals on ADK 4.10.x
| Component | Version Details |
|---|---|
| ADK | 4.10.5.2 |
| SCA UGP Solution | 4.x.41-1 |
| Global Diagnostic App (GDA) | 2.0.0 |
Installation Sequence for GDA Setup
The Following Sequence is for upgrading existing solutions with latest software mentioned above to have GDA running.
- ADK
- OTA (Valid for M440/M424 Only)
- SCA Solution
- SCA Configuration
- GDA and GDA configuration
Whitelisting URLs/IP Address
The Global Diagnostic App connects to the Verifone Event service to post the events. To ensure seamless connectivity and functionality of the Global Diagnostic App, it is essential to whitelist the following URLs/IP addresses on your network.
| URL | Version Details |
|---|---|
| STAGING URL: cst2.test-gsc.vfims.com/event-service/events/device | Global Diagnostic App uses this end point to connect and post events in the staging environment for customer testing. |
| PROD URL: gsc.verifone.cloud/event-service/events/device | Global Diagnostic App uses this end point to connect and post events in the Production environment. |
Registering for Webhooks
Customers can register to webhooks from Verifone and receive notifications about specific events. Here’s how you can set up and monitor events using webhooks:
-
- Registering for Webhooks To start monitoring events, you need to register your webhook URL with Verifone. Follow these steps:
-
- Provide your webhook URL: This is the endpoint where you want to receive event notifications.
- Specify the events: Indicate which events you want to monitor (e.g., Device Registration Failure, Encryption Setup Failure).
- Authentication: Ensure your webhook endpoint is secured and can authenticate incoming requests from Verifone.
- Webhook Event Format When an event occurs, Verifone will send a POST request to your webhook URL with the event data. The data will be in JSON format and include details such as event type, timestamp, device information, and specific event data. Here is a sample format:
{
  "objectType": "DeviceEvent",
  "eventId": "d94a63e5-3018-4265-a0da-36783d6661ad",
  "eventDateTime": "2025-03-26T05:33:27.001Z",
  "recordId": "0",
  "itemId": "0",
  "entityUid": "76e84daa-c954-4c6a-8f7f-09758c078669",
  "eoEntityUid": "76e84daa-c954-4c6a-8f7f-09758c078669",
  "source": "device",
  "received": "2025-03-26T05:33:28.500035811Z",
  "eventType": "",
  "content": {},
  "deviceType": "",
  "serialNumber": ""
}
- Validating Webhooks in Non-Production Environment: Before deploying webhooks in a production environment, it’s crucial to validate them in a non-production setting. Use lab devices to trigger the events and ensure your system correctly processes and responds to these events.
- Querying Events from Specific Terminals: You can query events on the webhook from specific terminals by using the terminal’s serial number or other identifiers. This allows you to filter and monitor events for particular devices, ensuring targeted diagnostics and troubleshooting.
-
- Handling Webhook Notifications: When your system receives a webhook notification, it should:
-
- Parse the JSON data: Extract relevant information such as event type, timestamp, and device details.
- Log the event: Store the event data for future reference and analysis.
- Trigger actions: Based on the event type, initiate appropriate actions such as alerting support teams, updating dashboards, or performing automated diagnostics.
- Monitoring Dashboard Set up a monitoring dashboard to visualize the events received via webhooks. This dashboard can provide real-time insights into the health of your payment devices, highlight critical issues, and track trends over time.
Architecture and Design
SCA payment application is responsible to identify the occurrence of specific events during the application flows, classify them and appropriately notify the Global diagnostic app regarding the event. The payment application provides the required data along with the event message which will help troubleshoot or gain further understanding regarding the event.
The events are in a JSON Format which are described in the further sections of this document.
There are 21 events as on the publication of this document and these Events can be classified as Critical and Non-Critical events. Critical events are those which may cause the payment application to fail initialization thus rendering it useless or when terminal does not have connectivity to the host causing SAF build up. The Critical events are sent to GDA as soon as they occur, allowing event consumers to act on them immediately. The Non-Critical are sent to GDA of once every 24 hours. This typically occurs after the 24-hour reboot.
These Events posted into Verifone event server will allow customers to register webhooks to notify them directly during the occurrence of the events. This allows customers the flexibility to maintain the required dashboard on their end for monitoring and acting on such events. Alternatively, customers can choose to sign up for sending emails and pulling additional diagnostic data from the terminals during the events.
Solution Architecture Overview
Events Throttling
To reduce the probability of network congestion caused by all terminals in customer estate posting the Diagnostic details at the same time after the 24-hour reboot occurs, the application supports Throttling logic.
The Throttling logic ensures that different terminals post the non-critical events at different instances, and the timing is calculated based on the Serial number as shown below.
If the serial number of the terminal is 321-456-789 and throttling window is set to 600 seconds (10 minutes), then the Throttling time is calculated as 321456789 Mod 600 which sets the throttling window to 189 seconds. The events will be posted 189 seconds after the 24-hour reboot window for such a terminal.
Events Format
Webhook Format:
Following is the generic format for the events that a subscriber will receive as a webhook notification.
Content Type: application/json
{
  "objectType": "DeviceEvent",
  "eventId": "d94a63e5-3018-4265-a0da-36783d6661ad",
  "eventDateTime": "2025-03-26T05:33:27.001Z",
  "recordId": "0",
  "itemId": "0",
  "entityUid": "76e84daa-c954-4c6a-8f7f-09758c078669",
  "eoEntityUid": "76e84daa-c954-4c6a-8f7f-09758c078669",
  "source": "device",
  "received": "2025-03-26T05:33:28.500035811Z",
  "eventType": "",
  "content": {
  },
  "deviceType": "",
  "serialNumber": ""
}
Where,
| Fields | Description |
|---|---|
| objectType: |
Type: string Value: DeviceEvent Type of Event or Object. Events from Health monitor and SCA would send value of DeviceEvent. |
| eventId: |
Type: string <uuid> The internally assigned identifier for the event. |
| eventDateTime: |
Type: string <date-time> The timestamp when the event occurred. This should be in local time with an offset to UTC specified to ensure this can be converted between time zones. |
| recordId: | Type: string |
| itemId: | Type: string |
| entityUid: |
Type: string <uuid> The Verifone allocated unique id for the entity this webhook/event is for. |
| eoEntityUid: |
Type: string <uuid> The internally assigned identifier for the estate owner/customer for the event. |
| Source: |
Type: string Value: device This internally assigned value indicates that the source of the event is from the Device. All health monitor events will have a source assigned to Device. |
| Received: |
Type: string <date-time> (eventDateTime) This timestamp indicates when the event was received to the Verifone server Database. |
| eventType: |
Type: string The value indicates the type of Event. The various possible event Types is provided in the next section. |
| content: |
Type: object The associated event data. This is optional and if specified will vary according to the event type. Refer to Supported Device Events setion for more details on the Event Formats of all device events. |
| deviceType: |
Type: string This value indicates the Device model from which the event has originated. Different Values supported - M400, M440, M424, P400, V400, E285, E280, P200 |
| serialNumber: |
Type: string. The device hardware serial number. |
The table above describes the basic event format to which all events must adhere. The following section provides a detailed overview of each event type and outlines the content fields specific to each event. The other fields are generic and apply to all events.
Supported Device Events
1. Device Registration Failure
| Fields | Description |
|---|---|
| Event Name: | DeviceRegistrationFailure |
| Priority: | Critical |
| Description: | This Critical event is triggered when the terminal is Unable to successfully perform Device Registration with the Gateway or Processor. For Some Direct to host solutions such as WorldPay this event is Not applicable since Device Registration is not needed. |
| Possible Cause: |
|
| Recommended Action: |
|
| Event Format: |
|
| Field Description: |
|
2. Encryption Setup Failure
| Fields | Description |
|---|---|
| Event Name: | EncryptionFailure |
| Priority: | Critical |
| Description: | This critical event is triggered when the Encryption Setup fails on the terminal. This is an indication that card data will not be encrypted and hence application stops the terminal from initializing if this step has failed. |
| Possible Cause: |
|
| Recommended Action: |
|
| Event Format: |
|
| Field Description: |
|
3. Test Sale Failure
| Fields | Description |
|---|---|
| Event Name: | PreambleSaleFailure |
| Priority: | Critical |
| Description: | This critical event is triggered when the terminal fails to successfully complete the Test Sale or Test Void during the initialization process. Installers usually perform this step to verify the setup after installation. In some merchant configurations, this step is disabled, so the event will not be generated or applicable for them. |
| Possible Cause: |
|
| Recommended Action: |
|
| Event Format: |
|
| Field Description: |
|
4. Canadian Debit MAC Key Setup Failure
| Fields | Description |
|---|---|
| Event Name: | MACKeyLoadFailure |
| Priority: | Critical |
| Description: | This Critical event is posted when the terminal is Unable to successfully update the MAC Key necessary for performing MACing of the Canadian Debit Transactions. |
| Possible Cause: |
|
| Recommended Action: |
|
| Event Format: |
|
| Field Description: |
|
5. Application Abrupt Restarts or Abrupt Terminal Reboots
| Fields | Description |
|---|---|
| Event Name: | AppAbruptRestarts |
| Priority: | Critical |
| Description: | This Critical event is posted when the application detects the terminal rebooted or application restarted in between the transaction flow or when it is not the idle screen. |
| Possible Cause: |
|
| Recommended Action: |
|
| Event Format: |
|
| Field Description: | Data - This field indicates the state of the terminal before the unexpected reboot occurred. It provides the last active command information and denotes if the terminal was within an Active session or not. |
6. Host Connection Status
| Fields | Description |
|---|---|
| Event Name: | HostConnectionStatus |
| Priority: | Critical |
| Description: | This Critical event is posted when the application detects that the connection to the payment gateway or processor is lost due to network issues or processor not reachable. The status field will display ConnectionFailure whenever the connection to the host is lost. Additionally, an event will be triggered when the connection is restored. This event will not be triggered for every successful connection to the host. |
| Possible Cause: |
|
| Recommended Action: |
|
| Event Format: |
|
| Field Description: |
|
7. Multiple SAF Retry
| Fields | Description |
|---|---|
| Event Name: | SAFMultipleRetry |
| Priority: | Critical |
| Description: | This Critical event is posted when the application detects that the same SAF Transaction is being forwarded more than 5 times. This event signifies a potential SAF stuck situation and will need to be addressed as early as possible. There is also the potential charging of the same card if the SAF is getting retried multiple times which needs to be investigated. |
| Possible Cause: |
|
| Recommended Action: |
|
| Event Format: |
|
| Field Description: |
|
8. Application Crash or Hang
| Fields | Description |
|---|---|
| Event Name: | ApplicationException |
| Priority: | Critical |
| Description: | This Critical event is posted when there is an exception, such as an application crash or hang during processing. The Failure reason field will differentiate between a crash and a hang. This error would signify a non-recoverable condition which in most cases would require to be followed by an application restart. These exceptions should typically not occur since this will result in payment application being unusable. |
| Possible Cause: |
|
| Recommended Action: | Capture the required diagnostics from the terminal such as Terminal logs and capture the screen on the terminal if it was an Application Hang. |
| Event Format: |
|
| Field Description: |
|
9. Payment Ready/ Not Ready State
| Fields | Description |
|---|---|
| Event Name: | PaymentReady |
| Priority: | Critical |
| Description: | This Critical event is posted when the application is ready to accept payments or is not in a state to process transactions. This event is especially useful during deployments or replacements of terminal to know if the terminal has initialized successfully and is ready to accept transactions. |
| Possible Cause: |
|
| Recommended Action: |
|
| Event Format: |
|
| Field Description: |
|
10. Host Response Timeout
| Fields | Description |
|---|---|
| Event Name: | HostResponseTimeout |
| Priority: | High |
| Description: | This High Priority event is posted when the application indicates it did not get a response back for the posted transaction. This should have resulted in a Timeout Reversal if the processor supports this or application recovery mechanism such as Auto Last Transaction to check the status of the previous transaction. |
| Possible Cause: |
|
| Recommended Action: |
|
| Event Format: |
|
| Field Description: |
|
11. POS Disconnection
| Fields | Description |
|---|---|
| Event Name: | POSDisconnection |
| Priority: | High |
| Description: | This High event is posted to notify a Disconnection from the POS. This can signify that the POS and Terminal may not be in sync with regards to the transaction status if this issue occurred while within a session. The event would provide details if the disconnection occurred within a session or during a Pairing process (For Bluetooth). |
| Possible Cause: |
|
| Recommended Action: |
|
| Event Format: |
|
| Field Description: |
|
12. Last Transaction Queries
| Fields | Description |
|---|---|
| Event Name: | LastTransactionQueries |
| Priority: | High |
| Description: | This High event is posted when the terminal receives Last Transaction query from the POS. The LAST Tran Command is typically sent to the terminal if there is some disconnect between POS and terminal causing POS to be out of sync. |
| Possible Cause: |
|
| Recommended Action: |
|
| Event Format: | No additional fields. |
13. SAF Details
| Fields | Description |
|---|---|
| Event Name: | SAFDetails |
| Priority: | High |
| Description: | This high priority event is posted by the application on every restart or reboot when there are SAF transactions in the database. It will include details of PROCESSED, DECLINED, ELIGIBLE, and NOT-PROCESSED, DEFFERRED SAF transactions. |
| Possible Cause: | This is a generic event posted during the application startup which would help merchant understand the status of the Store and Forward transactions. |
| Recommended Action: |
|
| Event Format: |
|
| Field Description: |
|
14. Duplicate Transactions
| Fields | Description |
|---|---|
| Event Name: | DuplicateTransactions |
| Priority: | High |
| Description: | This high priority event is posted by the application whenever it detects the duplicate transaction. This event could indicate that the customer was charged multiple times unless the transaction maps to different purchases by the same customer. |
| Possible Cause: |
|
| Recommended Action: |
|
| Event Format: |
|
| Field Description: |
|
15. Network Down
| Fields | Description |
|---|---|
| Event Name: | NetworkDown |
| Priority: | High |
| Description: | This high priority event is sent by application whenever it detects a network down event with any of the network interfaces, such as WIFI, GPRS, Bluetooth, USB or Ethernet. This event would signify the health of the Network. Not having a reliable network or stable network would result in a greater number of offline transactions or loss of business due to terminal being in offline state. |
| Possible Cause: |
|
| Recommended Action: | Identify the stores where the Network Down events occur the most and check for network stability concerns. attempt for another transaction or if the transactions were re-attempted because status of previous transaction was unknown. |
| Event Format: |
|
| Field Description: |
|
16. Poor Signal Strength
| Fields | Description |
|---|---|
| Event Name: | PoorSignalStrength |
| Priority: | High |
| Description: | The application will send this event whenever it detects that the signal strength of the WIFI or GPRS network is below the configured threshold limit. Refer to Related Configurations section to obtain details on SIGNALTHRESHOLDLIMIT parameter. |
| Possible Cause: |
|
| Recommended Action: |
|
| Event Format: |
|
| Field Description: |
|
17. Low Battery
| Fields | Description |
|---|---|
| Event Name: | LowBattery |
| Priority: | High |
| Description: | The application will send this event for battery-operated devices like E285, E280, V400 whenever the battery level falls below the threshold. The default threshold in the ADK level is 25%. |
| Possible Cause: |
|
| Recommended Action: |
|
| Event Format: |
|
| Field Description: | Data - Denotes the battery level in % |
18. Host Declined Transactions
| Fields | Description |
|---|---|
| Event Name: | HostDeclinedTransactions |
| Priority: | Medium |
| Description: | The application will send this event for every declined transaction from the Gateway/Processor. The event will include details such as the Host response code, Transaction Identifier, Transaction type and the response text received from the host. |
| Possible Cause: |
|
| Recommended Action: | Review the declined transactions and work with the Gateway/Processor to identify the reason for transactions which are not expected to be declined. |
| Event Format: |
|
| Field Description: |
|
19. Transaction Performance Time
| Fields | Description |
|---|---|
| Event Name: | TransactionPerformanceTime |
| Priority: | Medium |
| Description: | In this event, the application records the minimum, maximum, and average time taken for SALE transaction for each card entry mode (EMV CT, EMV CTLS, MSR, KEYED/MANUAL, ACCOUNT PASSTHROUGH). The event also records the minimum, maximum and average time taken for START and FINISH SESSION commands. |
| Possible Cause: | This is a generic event posted during the application startup which would help merchant understand the performance for sale transactions at various stores. |
| Recommended Action: |
|
| Event Format: |
|
| Field Description: |
The various containers are based on the different card entry modes - cardTokenTransactions, emvCTLSTransactions, emvCTTransactions, manualTransactions, msrTransactions, passThroughTransactions. |
20. Fallback Transactions
| Fields | Description |
|---|---|
| Event Name: | FallbackTransactions |
| Priority: | Medium |
| Description: |
The failurereason field will indicate the reason for the fallback. |
| Possible Cause: |
|
| Recommended Action: |
|
| Event Format: |
|
| Field Description: |
|
21. Card Not Supported
| Fields | Description |
|---|---|
| Event Name: | CardNotSupported |
| Priority: | Medium |
| Description: |
The data field will contain the detailed reason for the decline. |
| Possible Cause: |
|
| Recommended Action: |
|
| Event Format: |
|
| Field Description: |
|