Merchant Control Panel Dashboard
Overview
The Merchant Control Panel Dashboard acts as a homepage after the login and comes with a wide array of functionalities that allow live monitoring of the main business metrics, customization, and easy in-page navigation, while also offering extended reporting capabilities.
What can you do?
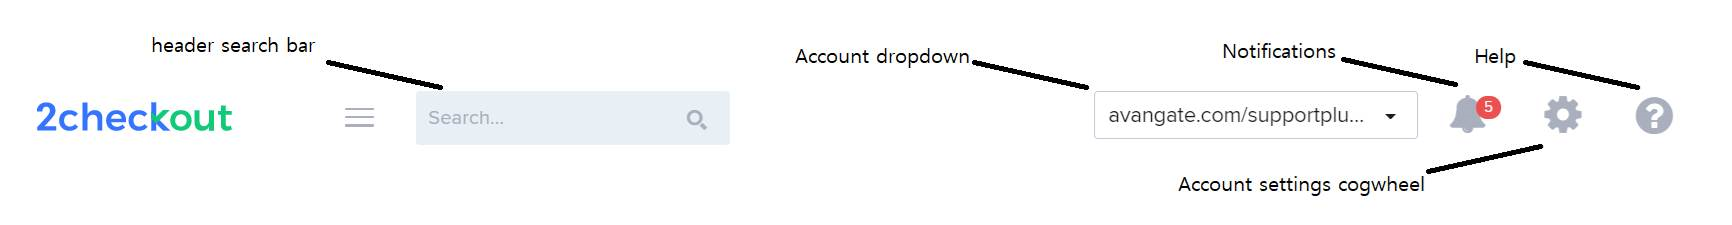
- Search orders, customers, and subscriptions via reference/email by using the header search bar.
- Easily switch between accounts with the Account dropdown.
- Easily access reports with a call to action included in each of the Dashboard's widgets.
- See notifications using the Notifications bell.
- Access the Knowledge Center articles by clicking the Help button – Documentation.
- Use the Account settings cogwheel to find your Merchant code, Settings, User management, System options, and the User details for your current user and also the Log Out button.
Track business metrics
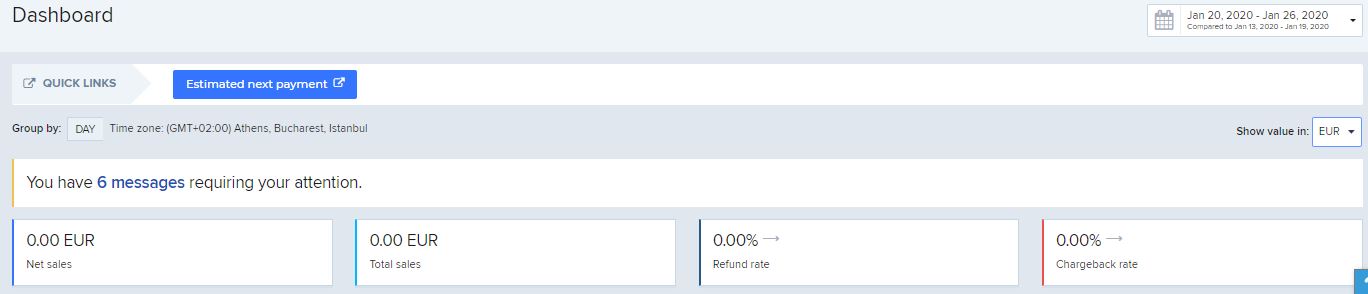
All the information displayed on the Control Panel dashboard is based on the timeframe previously selected. Data may be grouped by day, week, and month. Control the interval for which the data is being displayed, by selecting one of the predefined timeframes: today, yesterday, last 7 days, last 30 days, this month, last month, or set a specific timeframe with the custom range option.
The “Show value in” drop-down, allows you to choose the dashboard display currency.
You can easily access reports by using the call to action integrated into each of the dashboard's widgets. They act as a redirect to the reporting section, where you can pull detailed information about all your main business metrics. All the amounts displayed in the Control Panel Dashboard (with the exception of the Account Balance report) are calculated by converting your orders to your preferred Control Panel display currency using the daily exchange rates from the European Central Bank.
What information can you find here?
- Account balance – represents the estimated total revenue after all the taxes have been paid, commissions were applied and disputes (chargeback and refunds) amounts were retained and released.
- Total sales – this data corresponds to the total sales that were registered in the timeframe selected.
- Refund rate – is the value of the processed refunds in the selected interval divided by the value of finished orders (eStore, Affiliates, CM) in the same time period. Based on the threshold that was set, the arrow here can change, making it easier for you to notice any issues in time.
- Chargeback rate – represents the number of chargeback disputes that were generated in the timeframe selected, against the total number of orders placed in the previous comparison time frame. Depending on the trends and threshold the arrow can change color and orientation, making it easier for you to keep track of it.
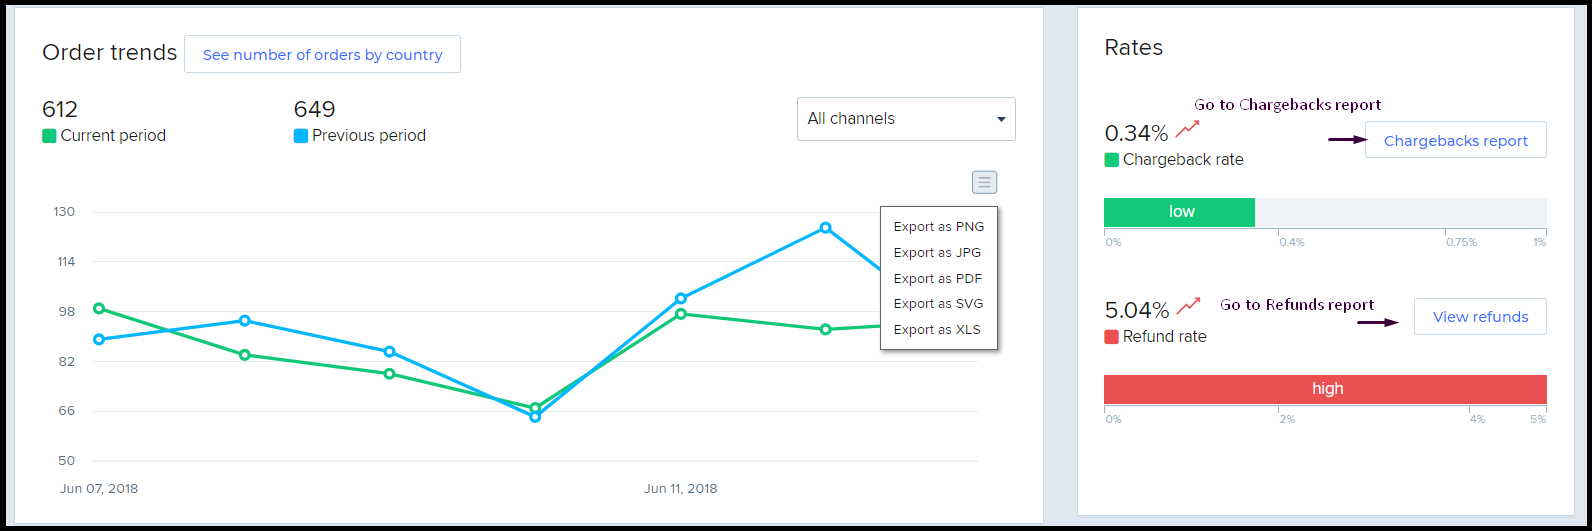
For more details on the Chargeback and Refund rates, the dashboard contains a separate widget, that also displays visual indicators.
Depending on the rating score and threshold exceeding the risk, the widget displays different colors: green (low rate and risk), orange (moderate rate and risk) and red (high rate and risk or threshold exceeded).
If you need further details about the Chargeback or Refund rates, you can use the button embed in the widget, which acts as a redirect to the main reports.
Live-monitoring of Sale Trends
Sales overview
- Monitor your sales trends. The widget displays the total sales value, the average order value (average value of all orders placed), and the total number of orders placed.
- View a forecast for your sales trends. If the data displayed in the dashboard also contains information from the current day, a forecast is computed for your sales trends. Alternatively, if you select a larger time interval for displaying the data (last 12 months), group the information by week/month to view a forecast of your trends.
- Values are displayed in comparison with the trends from the previous period.
- Export the information directly from the dashboard in the format you prefer.
Order trend monitoring
This widget allows you to:
- Monitor your order tendencies for the current interval in comparison with the previous period.
- View a forecast of your order trends. If the data displayed in the dashboard also contains information from the current day, a forecast is computed for your order trends. Alternatively, if you select a larger time interval for displaying the data (last 12 months), group the information by week/month to view a forecast of your trends.
- Filter the data displayed, based on the sales channels.
- Export the chart in different formats for better reporting and data interpretation, using the button integrated into the widget.
- Get easy access to the order report section through the button included in the widget.
Subscription, customer, and renewal evolution
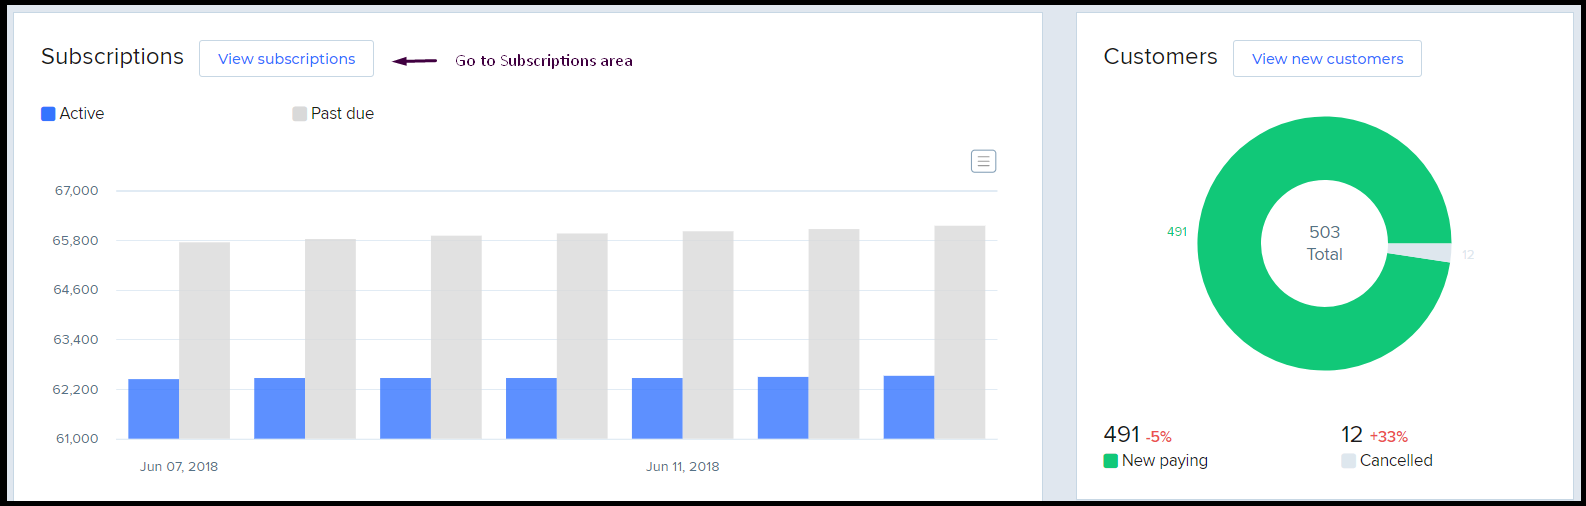
Subscription trends and customer evolution
Track your subscriptions' trend evolution, both for your active ones and those that are past due. Given the fact the subscriptions are in direct correlation with your customer retention rate, you can also monitor your customer pool evolution.
The evolution is registered under the total number of customers and the new ones that purchased one of your subscriptions, against those that have canceled the subscription.
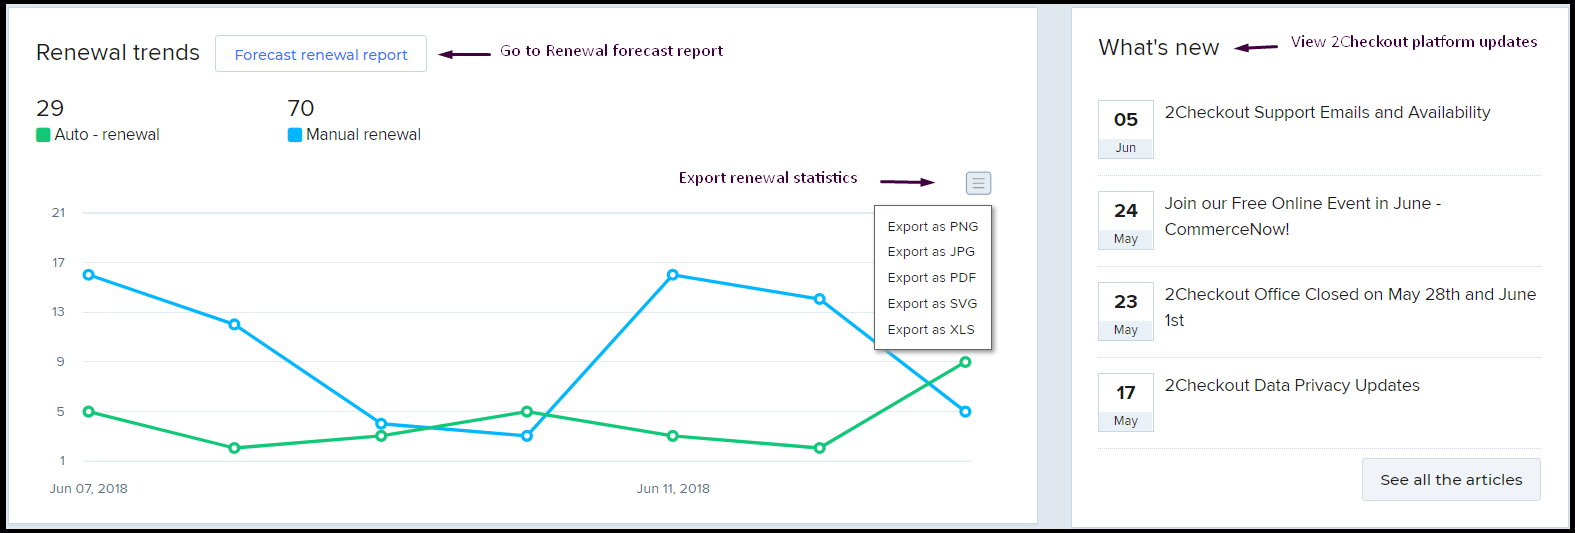
Renewal trends
Keep track of your subscription renewal trends with a widget that shows details and evolution for both automatic and manual renewals.
What’s new
Get easy access to the news feed and stay informed about all new features that are continuously released. Even though the section contains only the most recent ones, you can also check the older news with a click on the “See all the articles” button.
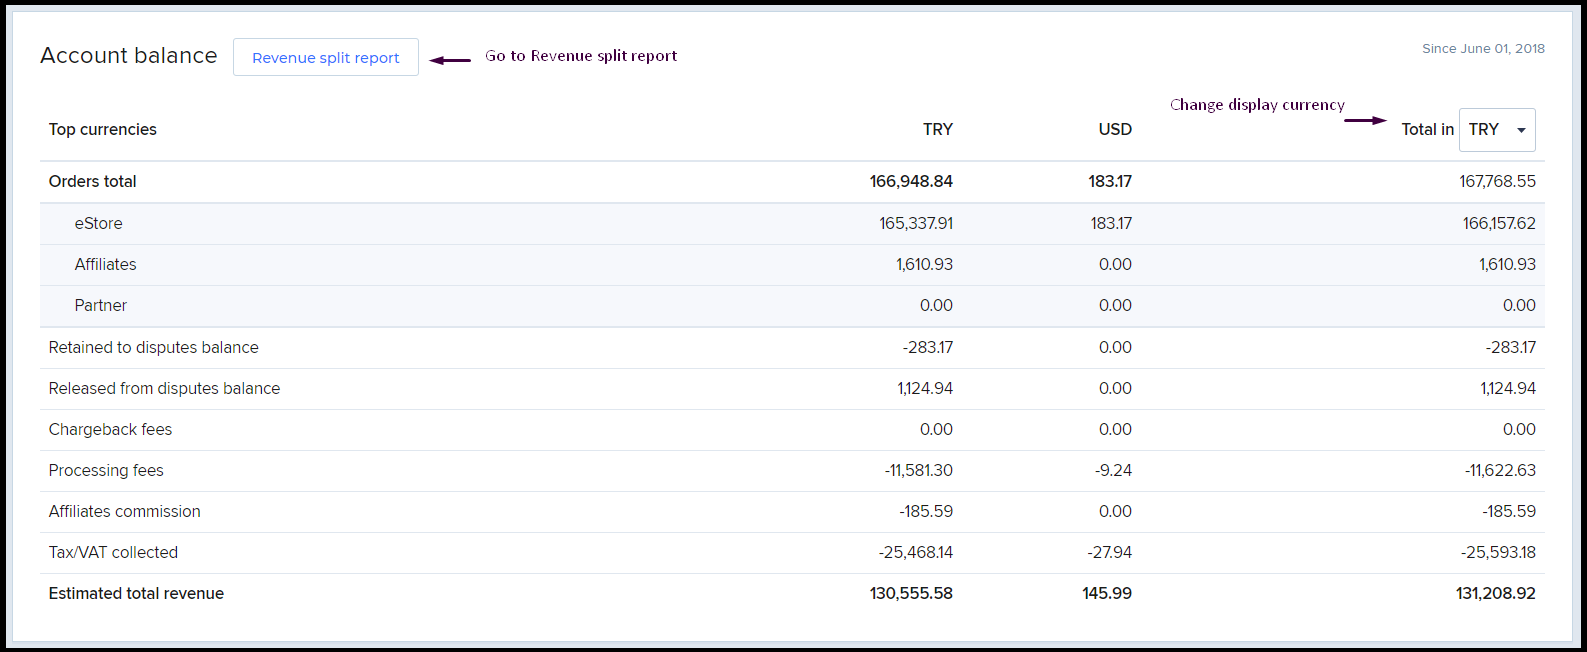
Stay up to date – Account balance
Account balance
Always keep track of your revenue with the Account balance widget. This report provides you information about:
- The total order value for each transactional currency.
- Overview of the total order value for each of your sales channels.
- Live-monitoring over the fees and taxes that were applied to your sales.
- Total estimated revenue generated for the given interval.
New orders are included in the Account balance report within 2-3 hours from the time they were completed. 2Checkout converts the amounts displayed in the Account balance report by using the exchange rate from your order currency to payout currency.
Integrate with 2Checkout
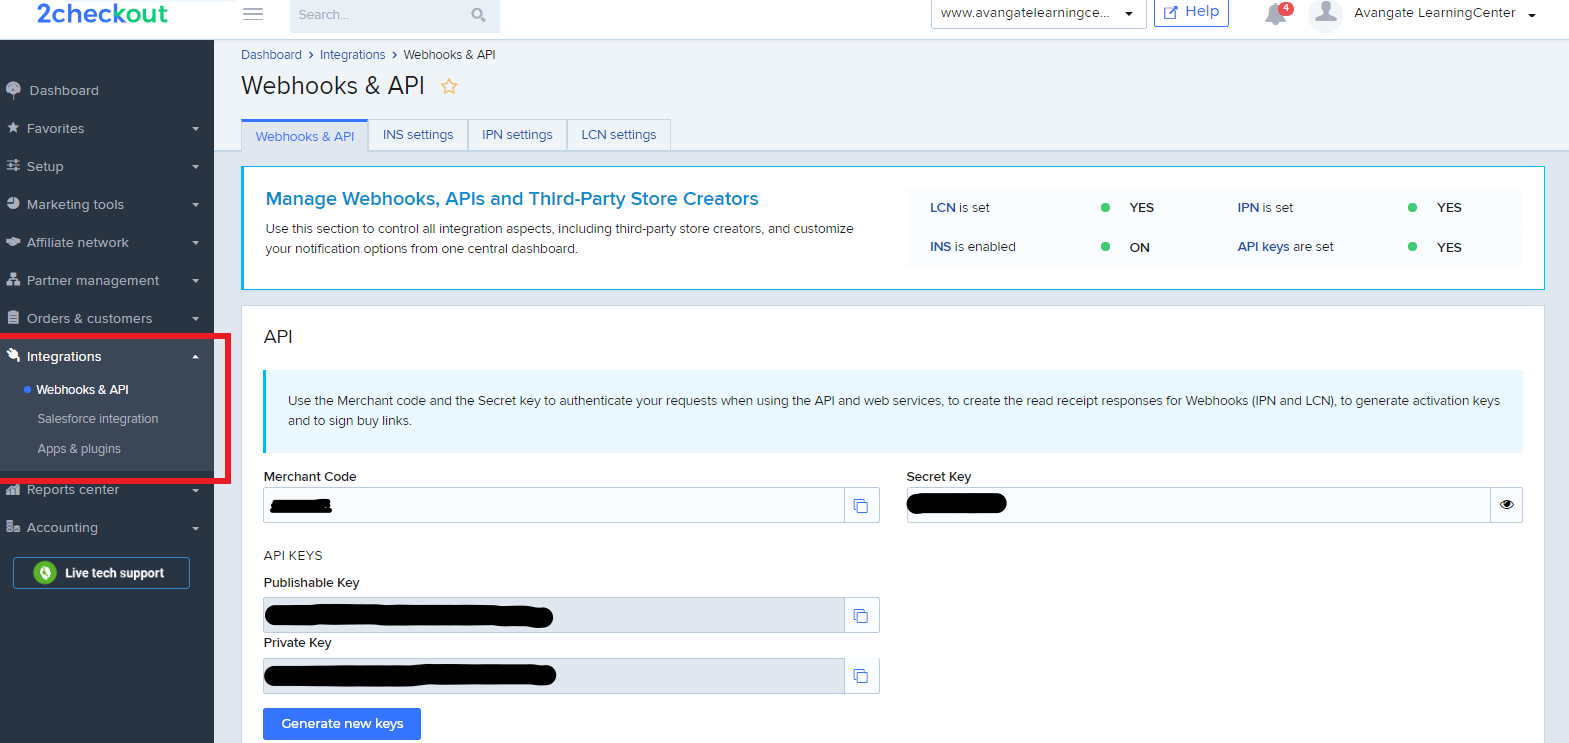
We’ve recently added a new Integrations sections to the Control Panel that includes webhooks, API, and other apps and plug-ins, which will ease the integration of your eCommerce platforms with 2Checkout and will help activate notifications like IPN, LCN, and INS in one single space with just a few clicks. The Webhooks and API section, as shown in the image below, controls all the integration aspects, including third-party store creators, and allows you to customize your notifications directly from the central dashboard. Also, in the Webhooks and API you'll find your 'merchant code' and 'secret key' for integration with third-party connectors (e.g. Shopify, WiX, Magento, WooCommerce, etc.).