Payments Dashboard
Overview
The payments dashboard brings the most important operational data in one place by providing insights that enable decisions to move your business forward.
From the navigation bar, in the top of the Verifone Central select Commerce and access the Payments Dashboard. Here you can access the transaction KPIs (Key Performance Indicators) for your organization(s) in a selected time frame. You can also select a baseline time frame to which you can compare your current data. The report is generated based on all transactions from all your payment channels such as Hosted Checkout, Pay-by-Link, Virtual Terminal, and POS.
Besides, selecting the organization along with the sub-organizations available for your account, you can also use the following filters:
- Date range
- Currency
- Channel
Select the organization
Click on the Organization filter to search and select the needed organization available for your account for which you want the KPI.
- You can also include the sub-organizations of the selected organization (if applicable).
Select the date range
Use the time frame filter to select the Current period interval for which the data is being displayed, by either selecting a date range, along with a time range, or one of the predefined time frames:
- Today
- Yesterday
- Last week - weeks start on Mondays
- Last Month
- Last 7 days
- Last 30 Days
- This time frame is referred to as the Current period.
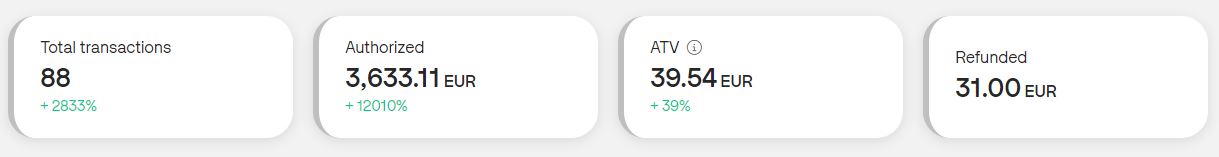
Comparing dates
If the Compare to checkbox is switched on, you can compare the data of the “Current period” to the "Previous period". The “Previous period” should have the same length as the “Current period”, and they should not overlap. When this option is selected, you will see a percentage on each KPI card indicating whether the value has increased or decreased compared to the selected date range. Additionally, under the graphs, you can see a visual representation of the differences between the “Current period” and the "Previous period".
Select the currency
Use the currency drop-down to show the transactions processed in that specific currency. If transactions are being processed with more than one currency, you will be able to filter per currency.
Select the channel
If you click the Add filter button, you can add an additional filter that enables you to filter for the sales channel (E-commerce, Mail, Phone, Point of sale).
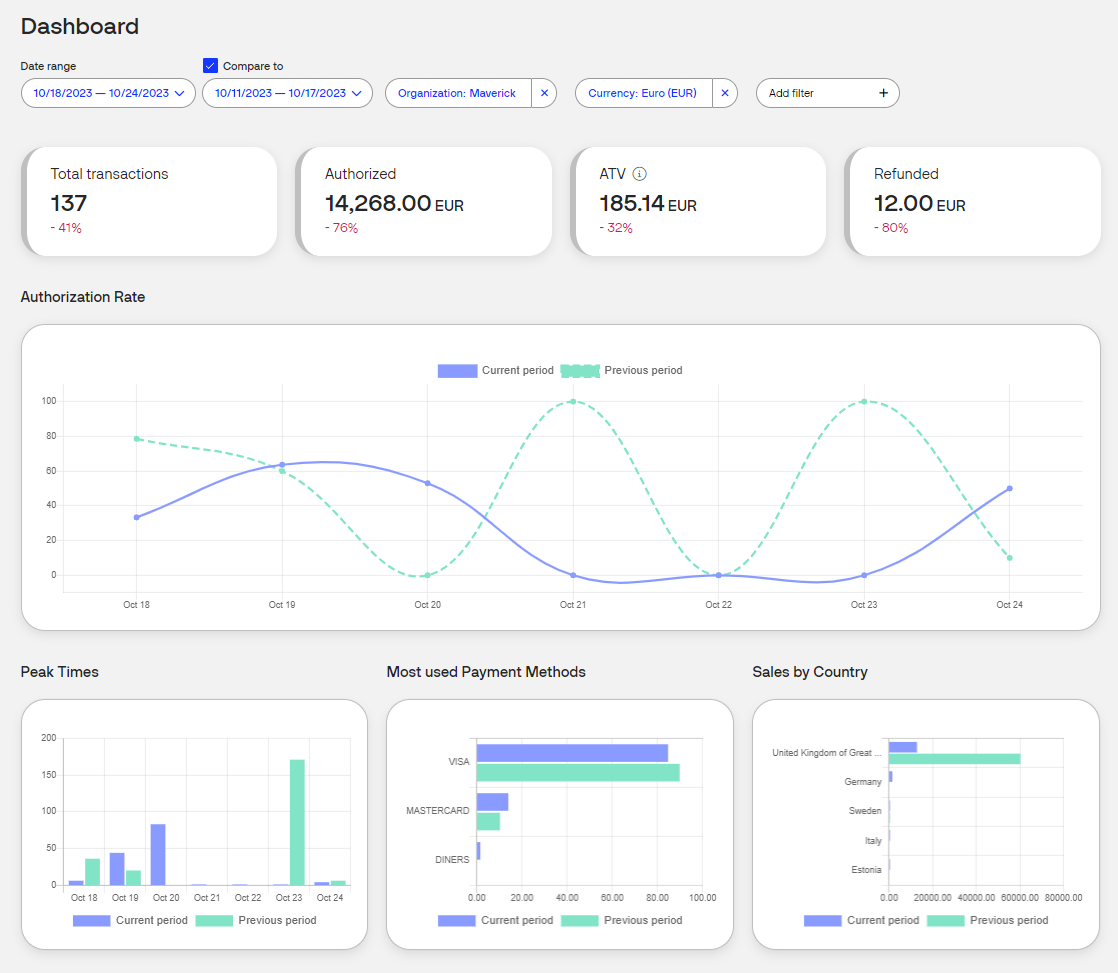
Track business metrics
All the information displayed on the Verifone Central KPI Dashboard is based on the time frame previously selected, and includes the following KPI's:
- Total Transactions: Measures the total number of transactions in a given period. Will count only transactions processed in the selected currency. Transactions that end up being refunded, voided, or cancelled are also included in the total number of transactions, unlike the Transactions Reports page.
- Authorized: Measures the total authorized amount performed over a period of time, across locations including physical stores and online transactions, per selected currency. Refunds do not affect the total authorized sales.
- ATV (Average Transaction Value): Shows the average worth of transaction amount for all purchases made under specified filters. It's computed by dividing the total value of transactions within a set timeframe by the total number of transactions during that period, excluding refund transactions.
- Refunded: The value of the total processed refund amounts in the selected time frame.
- Authorization Rate: Represents the percentage of transactions successfully authorized from the number of unique authorization attempts made, over the selected time frame.
- Most Used Payment Methods: Shows an ordered list of most popular payment methods per selected organization and currency.
- Peak Times: Payment traffic for all the reported transactions (declined, authorized, failed) over the selected time frame.
- Sales by Country: Measures the total amount of settled transactions over the selected period per country, based on the merchant location.
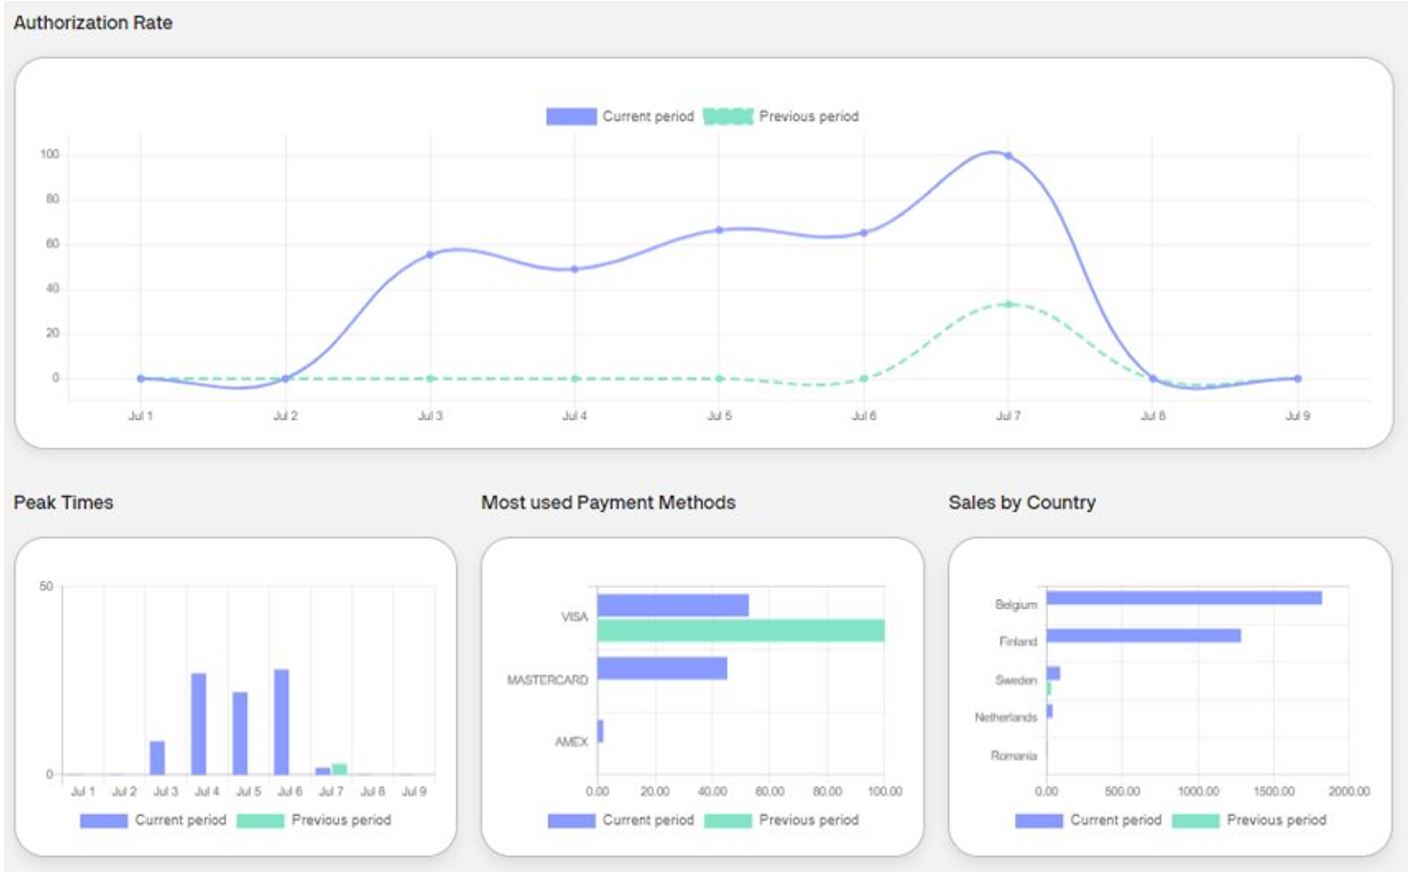
Graphs
The granularity of the graphs displayed for the Authorization Rate and Peak Times KPI is dependent on the length of the selected time frame. If the length is one day, then you will see hourly data. If the length is up to one month, you will see daily data. For longer periods, you can see weekly data, and then above three months you can see monthly aggregated data.