Grafana
Tutorial requirements
- Complete the Telegraf tutorial so your data is sent to your organization InfluxDB server.
- Set up an account with Grafana to continue.
Set up Grafana
After you register with Grafana, go to the Configuration Menu (Figure 1.1) and select Data Sources.
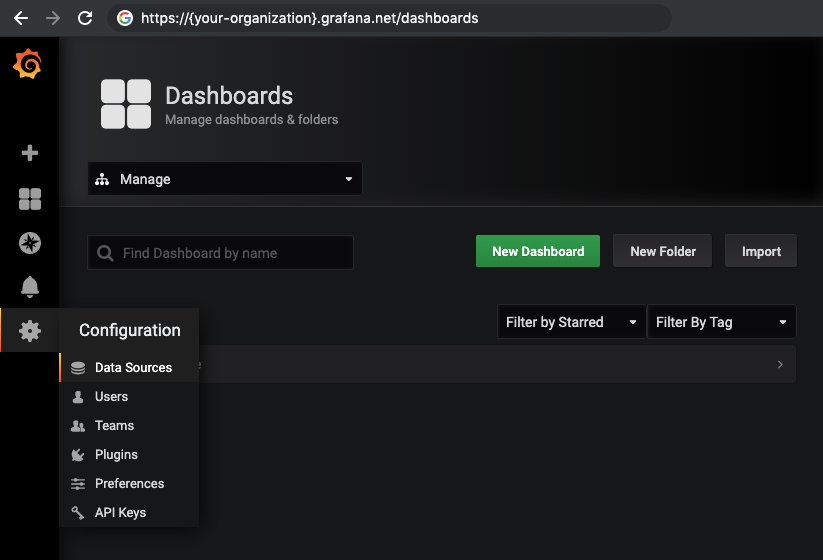
Figure 1.1 - Configure a data source for your organization at Grafana."
Figure 1.2 shows your organization Grafana Data Sources available for charting.
NOTE
This is the InfluxDB server that was set, as an environment variable, when installing Telegraf: "INFLUXDB_HOST": "{{influxdbHost}}"
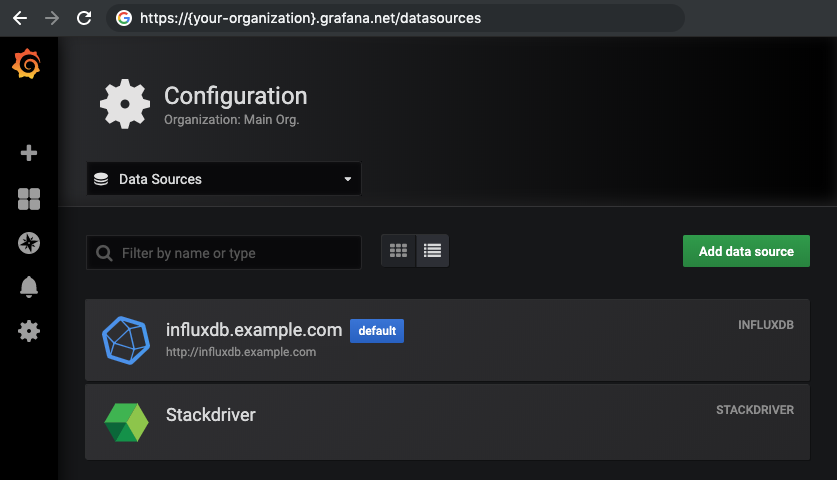
Figure 1.2 - You will need to add an InfluxDB data source pointing to your server.
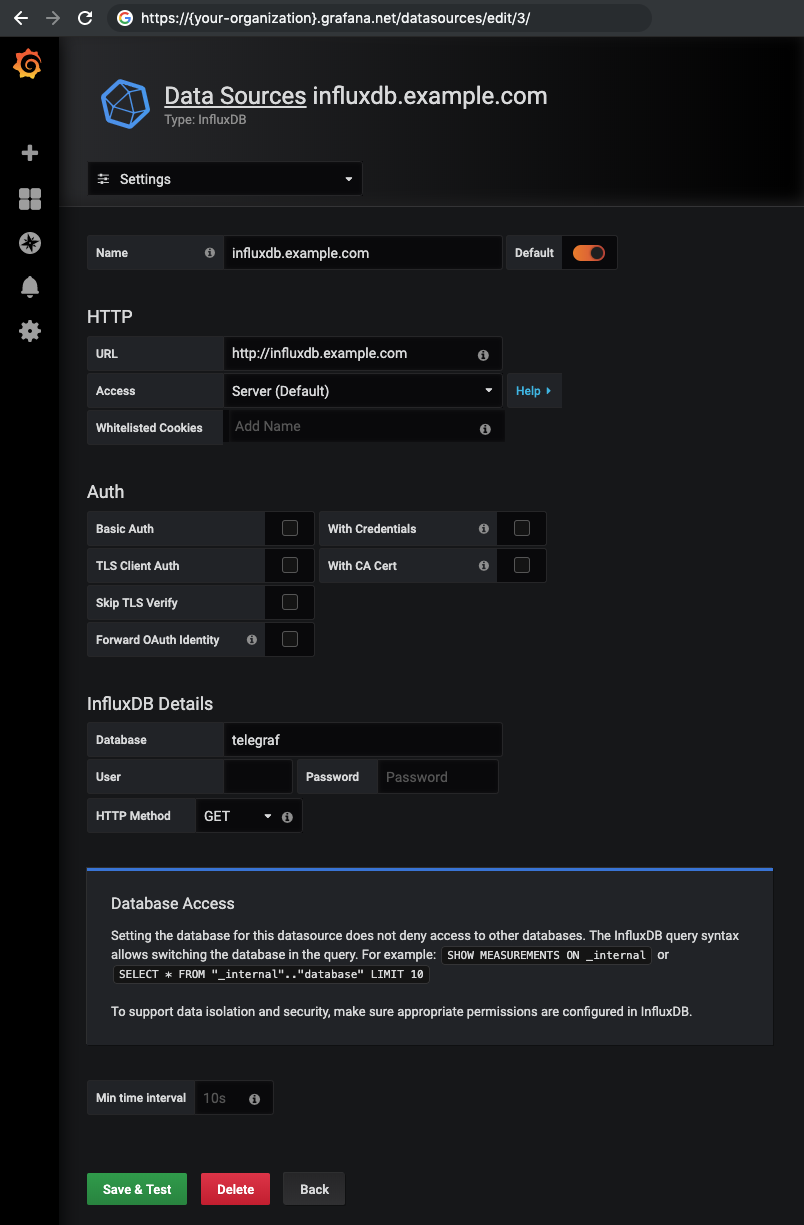
Once you clicked Add data source (Figure 1.2), you will need to configure the InfluxDB your organization has already set up, see Figure 1.3.
Now that your data source is set up, you can visualize Oak Device metrics, see Figure 1.4.
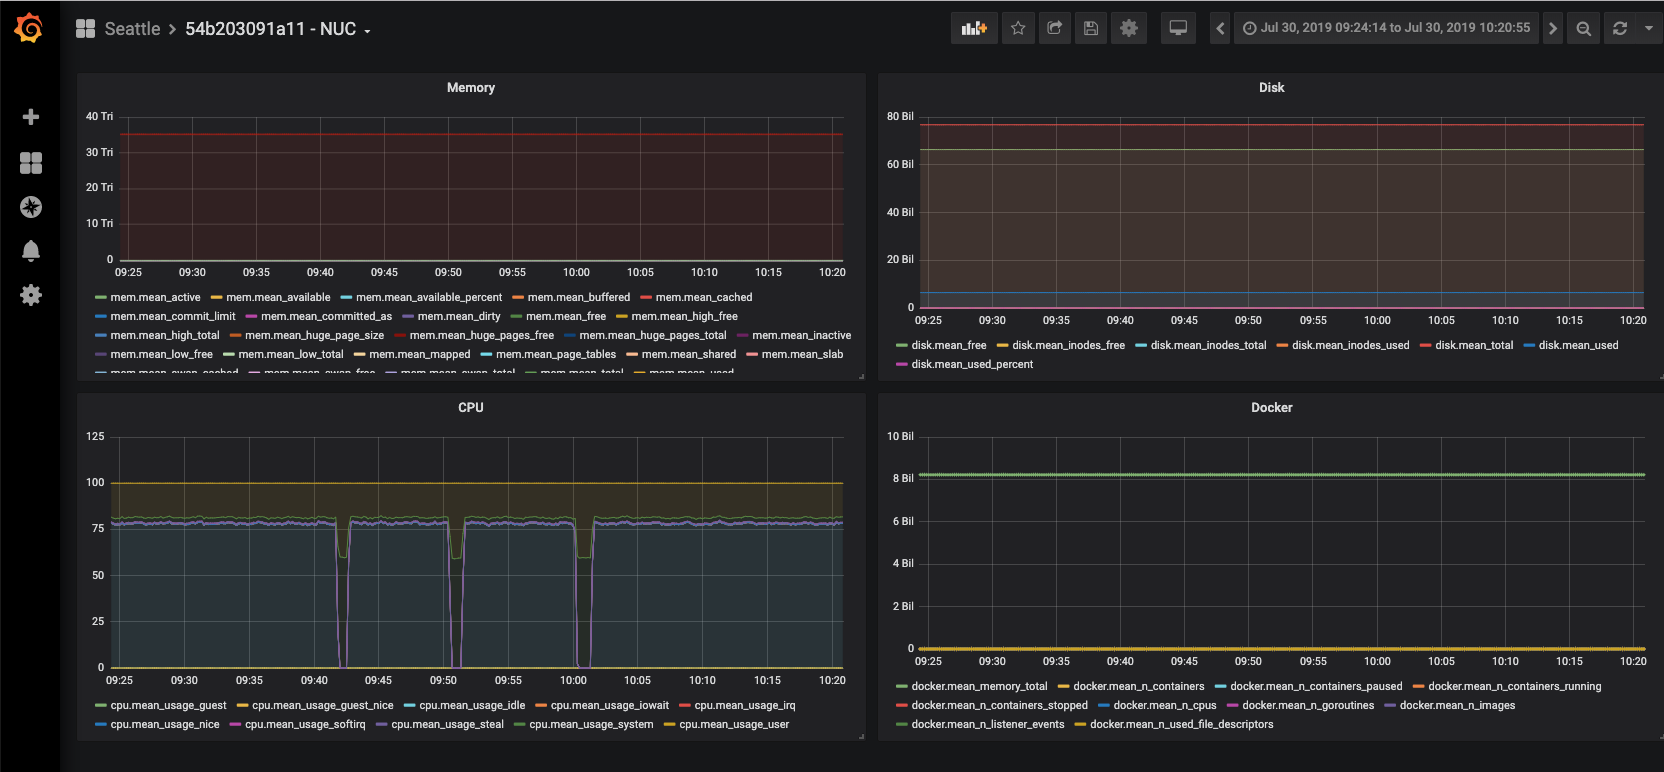
Figure 1.4 - Metrics for an Oak Device; visualized in Grafana.